'Geography Of Hate' Uses Twitter Data To Map Most Racist And Homophobic Places In America
Social Media, for all its beneficial qualities, can also be quite the hot bed for racist, homophobic and ableist thinking. Floating Sheep, a group of geography academics, has created the "Geography of Hate" in this vein, using Twitter data to map the most hate-filled states in America.
150,000 geotagged tweets in North America between June 2012 and April 2013 were taken, with students at Humboldt State University manually reading and coding the sentiment of each post. This 'extra yard' of effort beyond simply cataloguing mentions of racial/homophobic slurs is to determing if the specific word was used in a positive, negative or neutral way.
To clarify that last part, as Floating Sheep explained, while the term "dyke" is a homophobic slur against lesbian people, it was also used positively at San Francisco's Gay Pride Parade ("dykes on bikes #SFPride").
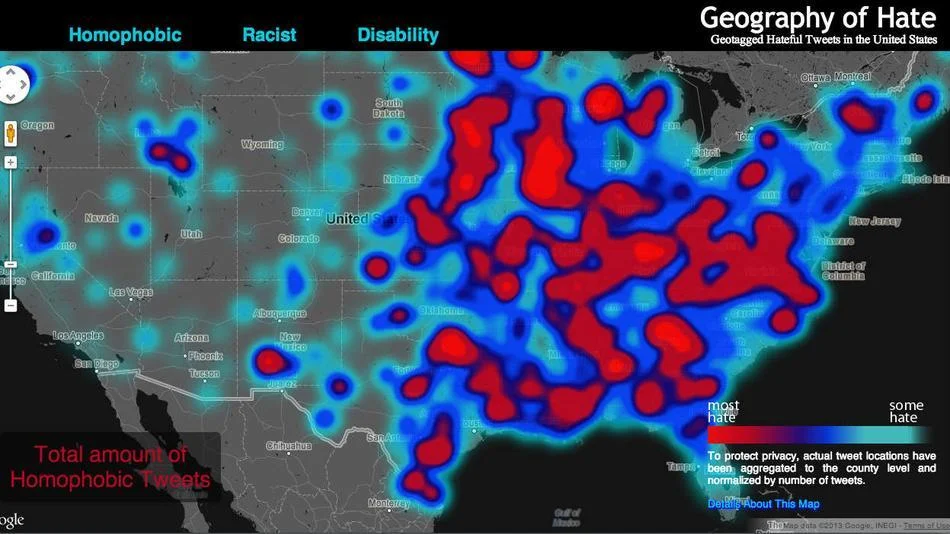
All of this data has been transformed into what you see, a heat map of derogatory statements in each county. "Hateful tweets were aggregated to the county level and then normalized by the total number of tweets in each county. This then shows a comparison of places with disproportionately high amounts of a particular hate word relative to all tweeting activity," the group said.
According to the map, Orange County in California has the highest number of tweets containing slurs; but this is affected due to its significantly higher level of overall Twitter activity.
Source: Geography of Hate