

Infographic: A Break Down Of The Internet In A Day
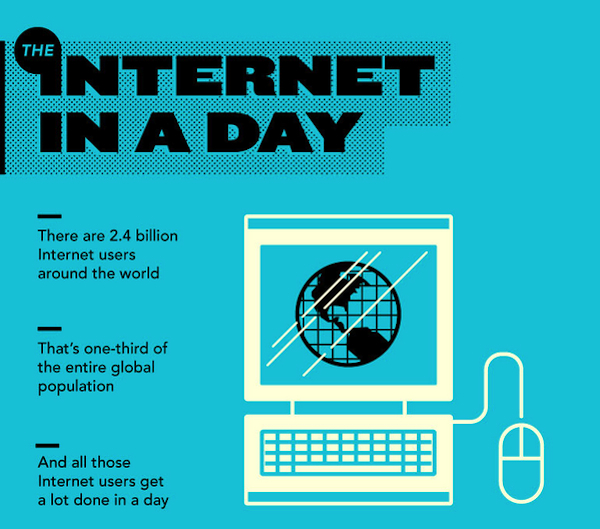
The internet is vast. It is a constantly changing landscape of GIFs and cats, which will make our future generations severely question our levels of productivity (blame Reddit). But what exactly happens in a single day on the web? How much content is created and shared in this enormous virtual space? The team at internetserviceproviders.org investigated and produced this rather nifty infographic about it.
Infographic: How Much Power Does The Internet Consume?
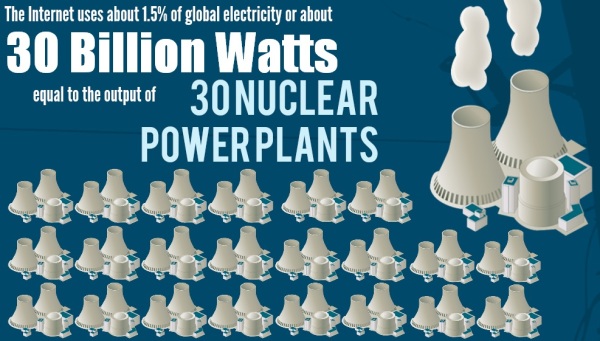
It's something that we now take for granted in our daily lives, but how often do we spare a thought for the energy poured into data centers minute-by-minute to keep our World Wide Web alive and kicking? With some 2.4 billion users generating the equivalent of around seven million DVD's worth of content every single hour – and the amount of data estimated to quadruple by 2016 - it's a question that nevertheless ought to be pondered. So exactly how power-hungry is the Internet? Allow Wireless Satellite Internet to demonstrate...
[Infographic] The Internet, A Decade Later
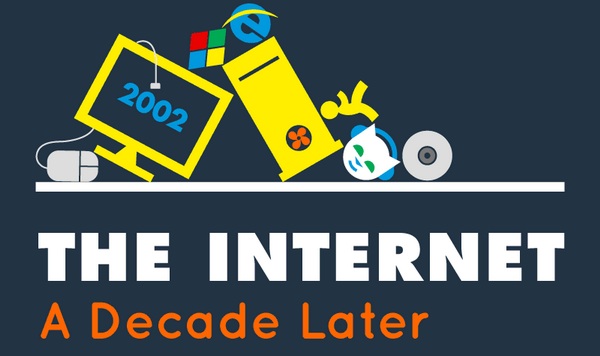
The Internet has come a heck of a long way in the short 10 years since 2002. Ultra-fast broadband has taken the place of the blips and bleeps of 56Kb dial-up systems; flashy ads, high-resolution pictures and interactive banners have replaced basic HTML coding; while the introduction of ‘Web 2.0’ has changed the way in which we interact with the World Wide Web forever.
Infographic: The Cost Of Being Batman

With the possible exception of Tony Stark, Batman is probably one of the more wealthier superheroes in comic book world. With Wayne Manor costing $600,000,000 alone, along with the insurmountable costs of being the masked crusader, the costs are going to be huge.
Star Wars By The Numbers
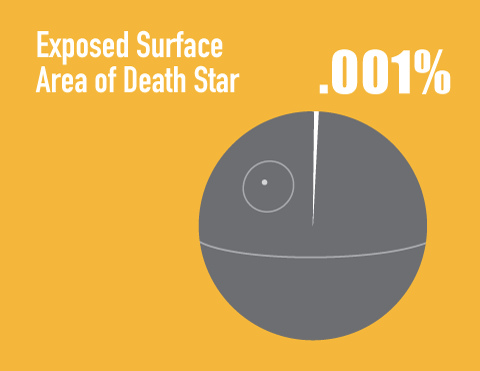
Ever felt the urge to travel a galaxy far far away, to many-a-wretched hive of scum and villainy? Well you must ensure that you don't leave without gathering as much research and knowledge about the universe as possible, which is where these extremely important infographics become a must-read.
How Memes Occur And Spread Online

Rickrolling, The Success Kid and The Trololo guy. Not only are they subject to 'Cat-breaded Taylor Swifting' parody on South Park; but they appear within the viral public space without much public knowledge as to how they got there.
Design Project Visualises How Well You Know Your Facebook Friends

Out of all the Facebook friends you have, their probably is a good chance that you may not physically know a good percentage of them. So the question would be just how many of them are what you'd call 'real' friends? This is what designer Colin Pinegar answered in his project, simply titled 'Best Friends.'
Infographic: Cash. Apple's got it

So after Apple's Quarterly profits report, it's fair to say that the old saying 'made of money' goes some way to describing the state of the company at the moment. It seems rather difficult to question just how far $400 billion could really be used, likened to asking similar questions such as "how long is a piece of string?" If split evenly, how much can Apple pay each of it's employees? How much of this money is 'reserve cash?' And, most interestingly, how many countries' worth of public debt can the reems of profit pay off? All this and more in our favourite infographic of the moment, courtesy of MBAonline.com.
Infographic: Bill Gates is better than Batman

In what initially seems to be an odd comparison of two people, one of the richest and most philanthropic individuals to come out of the Silicon Valley boom is put through his Top Trumps-esque paces against the masked crusader of Gotham City. Read further down and it does start to make sense: the challenge of how two incredibly rich men save lives in their respective fiction/non-fictional worlds. Our favourite infographic of the moment, courtesy of Frugal Dad.
Infographic: Facebook updates get more likes, whereas negative gets more comments
Infographic: A History of Western Typefaces
Infographic: Tech Germs
Infographic of the day: Death and Gravestone symbolism
Infographic of the day: The History of Digital Storage
Infographic of the day: Michael Bay
Lets be honest, even though the simple title "Infographic of the day" seems menial enough, the fact that the name "Michael bay" has been put just a colon and space to the right of it just makes the whole affair seem more epic.
But enough of that, we know the first thing anyone thinks about when they hear of Bay is the explosions. How many have their been in the history of his film-making career? And what is the correlation between the amount of explosions, and the amount of money his films make? These are questions that Kyle Vanhove answered in our Infographic(s) of the day.